Outlier Detection: Border Security For Your Model

Image Credit: zhu difeng / Shutterstock.com
You might not know it, but outlier detection is a big part of your life. The ability to notice diseased or rotten food, or spot a person in a crowd who might be unstable or dangerous is a very important human skill. Many of us had extra detection-training as children.
So can we reliably spot outliers? For extreme examples, we're pretty good. Say you ask 100 people, “what is the ideal indoor temperature?” and 99 of them answer, “somewhere between 16 and 22 degrees Celsius”, while the other one answers, “banana”. You don't have to be a Family Feud judge to know that there's something up with that banana answer. It's obviously an outlier. But, as the data gets more complex and convoluted, outliers start to get orders of magnitude more difficult to spot.
In machine learning, especially with financial models, outlier detection is incredibly important. Outliers can severely warp your training set, leaving you with a less accurate model and more errors in predictions. It's like using faulty materials to build the foundation of your house. Your training set can be contaminated by a number of different sources depending on how the data is collected. Anything from a clerical error to a computational anomaly to plain old human stupidity. (Never underestimate human stupidity--it's not an outlier as a cause of outliers.)
In some cases of machine learning you might be interested in investigating these outliers; those that are actual anomalies can hold lots of interesting information. However, for the case of predicting future returns, you are best served removing these outliers from your data before creating your model.
Removing them is the easy part, finding them is the real challenge. Outliers are sneaky things; they are completely dependent on the rest of the dataset. If you're a 400-pound man wearing nothing but a cloth diaper and a ponytail, you're a huge outlier in most situations. But, in a dohyō, you're just another data point.
The textbook definition will tell you that an outlier is an observation that lies outside the overall pattern of a distribution, but that's a bit of a vague explanation. It leaves us with some questions, the main one being: how far outside the pattern does a point have to be to be an outlier? It's like following one of your grandmother recipes. You just end up screaming at the page: “I DON’T KNOW HOW MUCH A 'HEALTHY DOSE' OF SALT IS GRANDMA, WHY CANT YOU BE SPECIFIC?”
So, if these outliers are so elusive, how do we find them? Luckily, some very smart people have discovered some very smart methods to help us in our task, such as
Z-Score
The z-score is like a hammer: basic, simple, easy to use. Not every situation calls for a hammer, but when something needs to be hammered, there's no better tool. The z-score is simply a measure of how many standard deviations a data point is from the sample's mean. Anything beyond a specified threshold (often 2.5-3.5 standard deviations) is deemed an outlier. It's surprisingly powerful given its simplicity, but there's a major catch: it requires your data to be approximately normally distributed, and your independent variables to be few. Also, because this tool relies on standard deviation, and standard deviation is sensitive to outliers, the very outliers you’re trying to detect could interfere with your calculations. That is why some people prefer the slightly modified Z-score method that uses Median Absolute Deviation instead of standard deviation. This reduces the effect of the outliers on your detection.
Z-Score isn't a method for every situation, but, when the stars align, it's an easy-to-implement, efficient solution.
DBSCAN
DBSCAN is as clever an algorithm as it is clunky an acronym. It stands for Density Based Spatial Clustering of Applications with Noise (obviously), and it works by determining the number of neighbouring points that exist for each data point in the set. By setting a distance, ɛ, you tell the algorithm how far to search for neighbours. You also set the minimum density of the neighbours that you're searching for, and set it to work. The algorithm classifies each point into one of three categories: 1) Core points, 2) Border points 3) Outliers.
If a point has at least the minimum number of neighbours within ɛ distance in any direction, it's considered a core point. If a point doesn't have the minimum number of neighbours, but is within ɛ distance of a core point, it is considered a border point. If it doesn't fit into either of those classifications, it's an outlier. By modifying ɛ and the minimum number of neighbours, you are able to fine-tune the outlier classification.
It's an easy to visualize method, and it works very well for searching for multidimensional outliers, but it's not without its drawbacks. It’s difficult to fine-tune the parameters ( ɛ and minimum number of neighbours). A small change in values can cause a dramatic change in outliers detected. You also need to scale your values in the feature space appropriately, lest you wreck your results.
Isolation forest
Despite sounding like a place that you'd get banished to in some Alice in Wonderland-esque tale, an isolation forest is actually a non-parametric method of outlier detection. It's a thorough machine-learning algorithm that seeks to determine how isolated each data point is, and give it an according score. This is done using decision trees in the following order. For each data point, you randomly select a feature. For that feature, you take a random value between the minimum and maximum to function as your split value. If the current data point has a value above the split value, you now use only the data above that point. If it's below, use only the data below. You then choose another feature at random, and another value in between the minimum and maximum, and repeat the process. Continue to do so until the data point is completely isolated from the rest of the set.
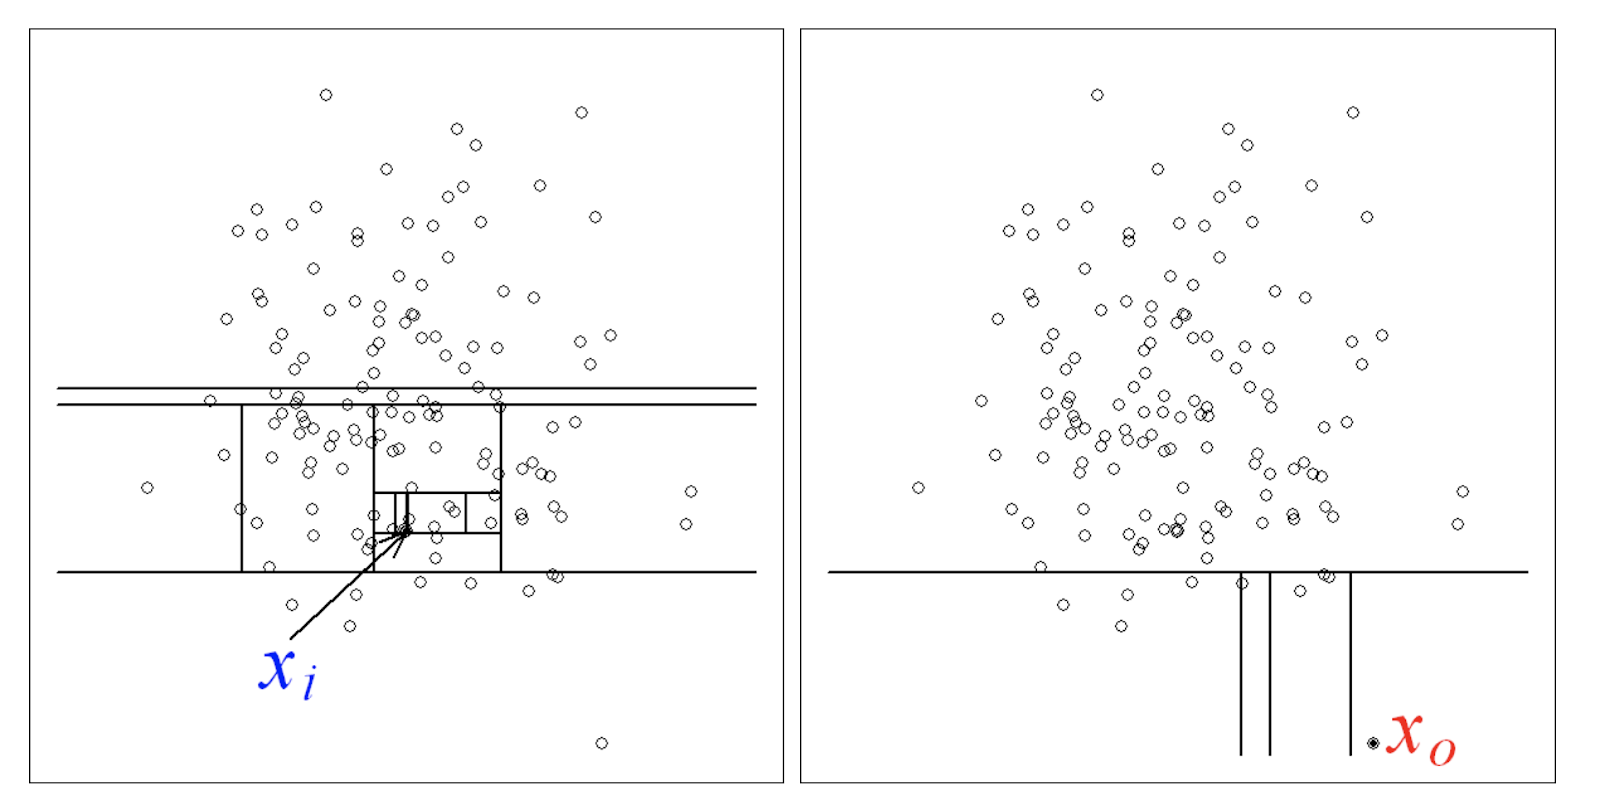
(picture reference: https://cs.nju.edu.cn/zhouzh/zhouzh.files/publication/icdm08b.pdf )
Because outliers (X0) will be further from the rest of the data than an average point (Xi), it should take substantially fewer steps to isolate an outlier (Figure 1). By comparing the number of steps it takes with the benchmark value that you decided on, you can determine if the data point is an outlier. It's a very clever algorithm, but, if it's not implemented properly, it can be very slow and computationally expensive.
Much like with Z-Score, there is also an extended isolation forest method that improves the consistency and reliability of the algorithm by re-imagining how the splits are calculated.
Conclusion
Outlier detection is incredibly important in machine learning. You want to protect the borders of your model from bad data with the fury of a wall-loving Donald Trump, but with the cleverness of anyone but. Be as vigilant as possible. In practice, you may need a combination of these methods to get a complete sense of your data. We employ both z-score and isolation forest techniques in our projects to ensure that we are using the cleanest possible information to create predictions. It may seem labor intensive, but every little edge can turn into a greater alpha on the other end.


